Step changes in ecommerce
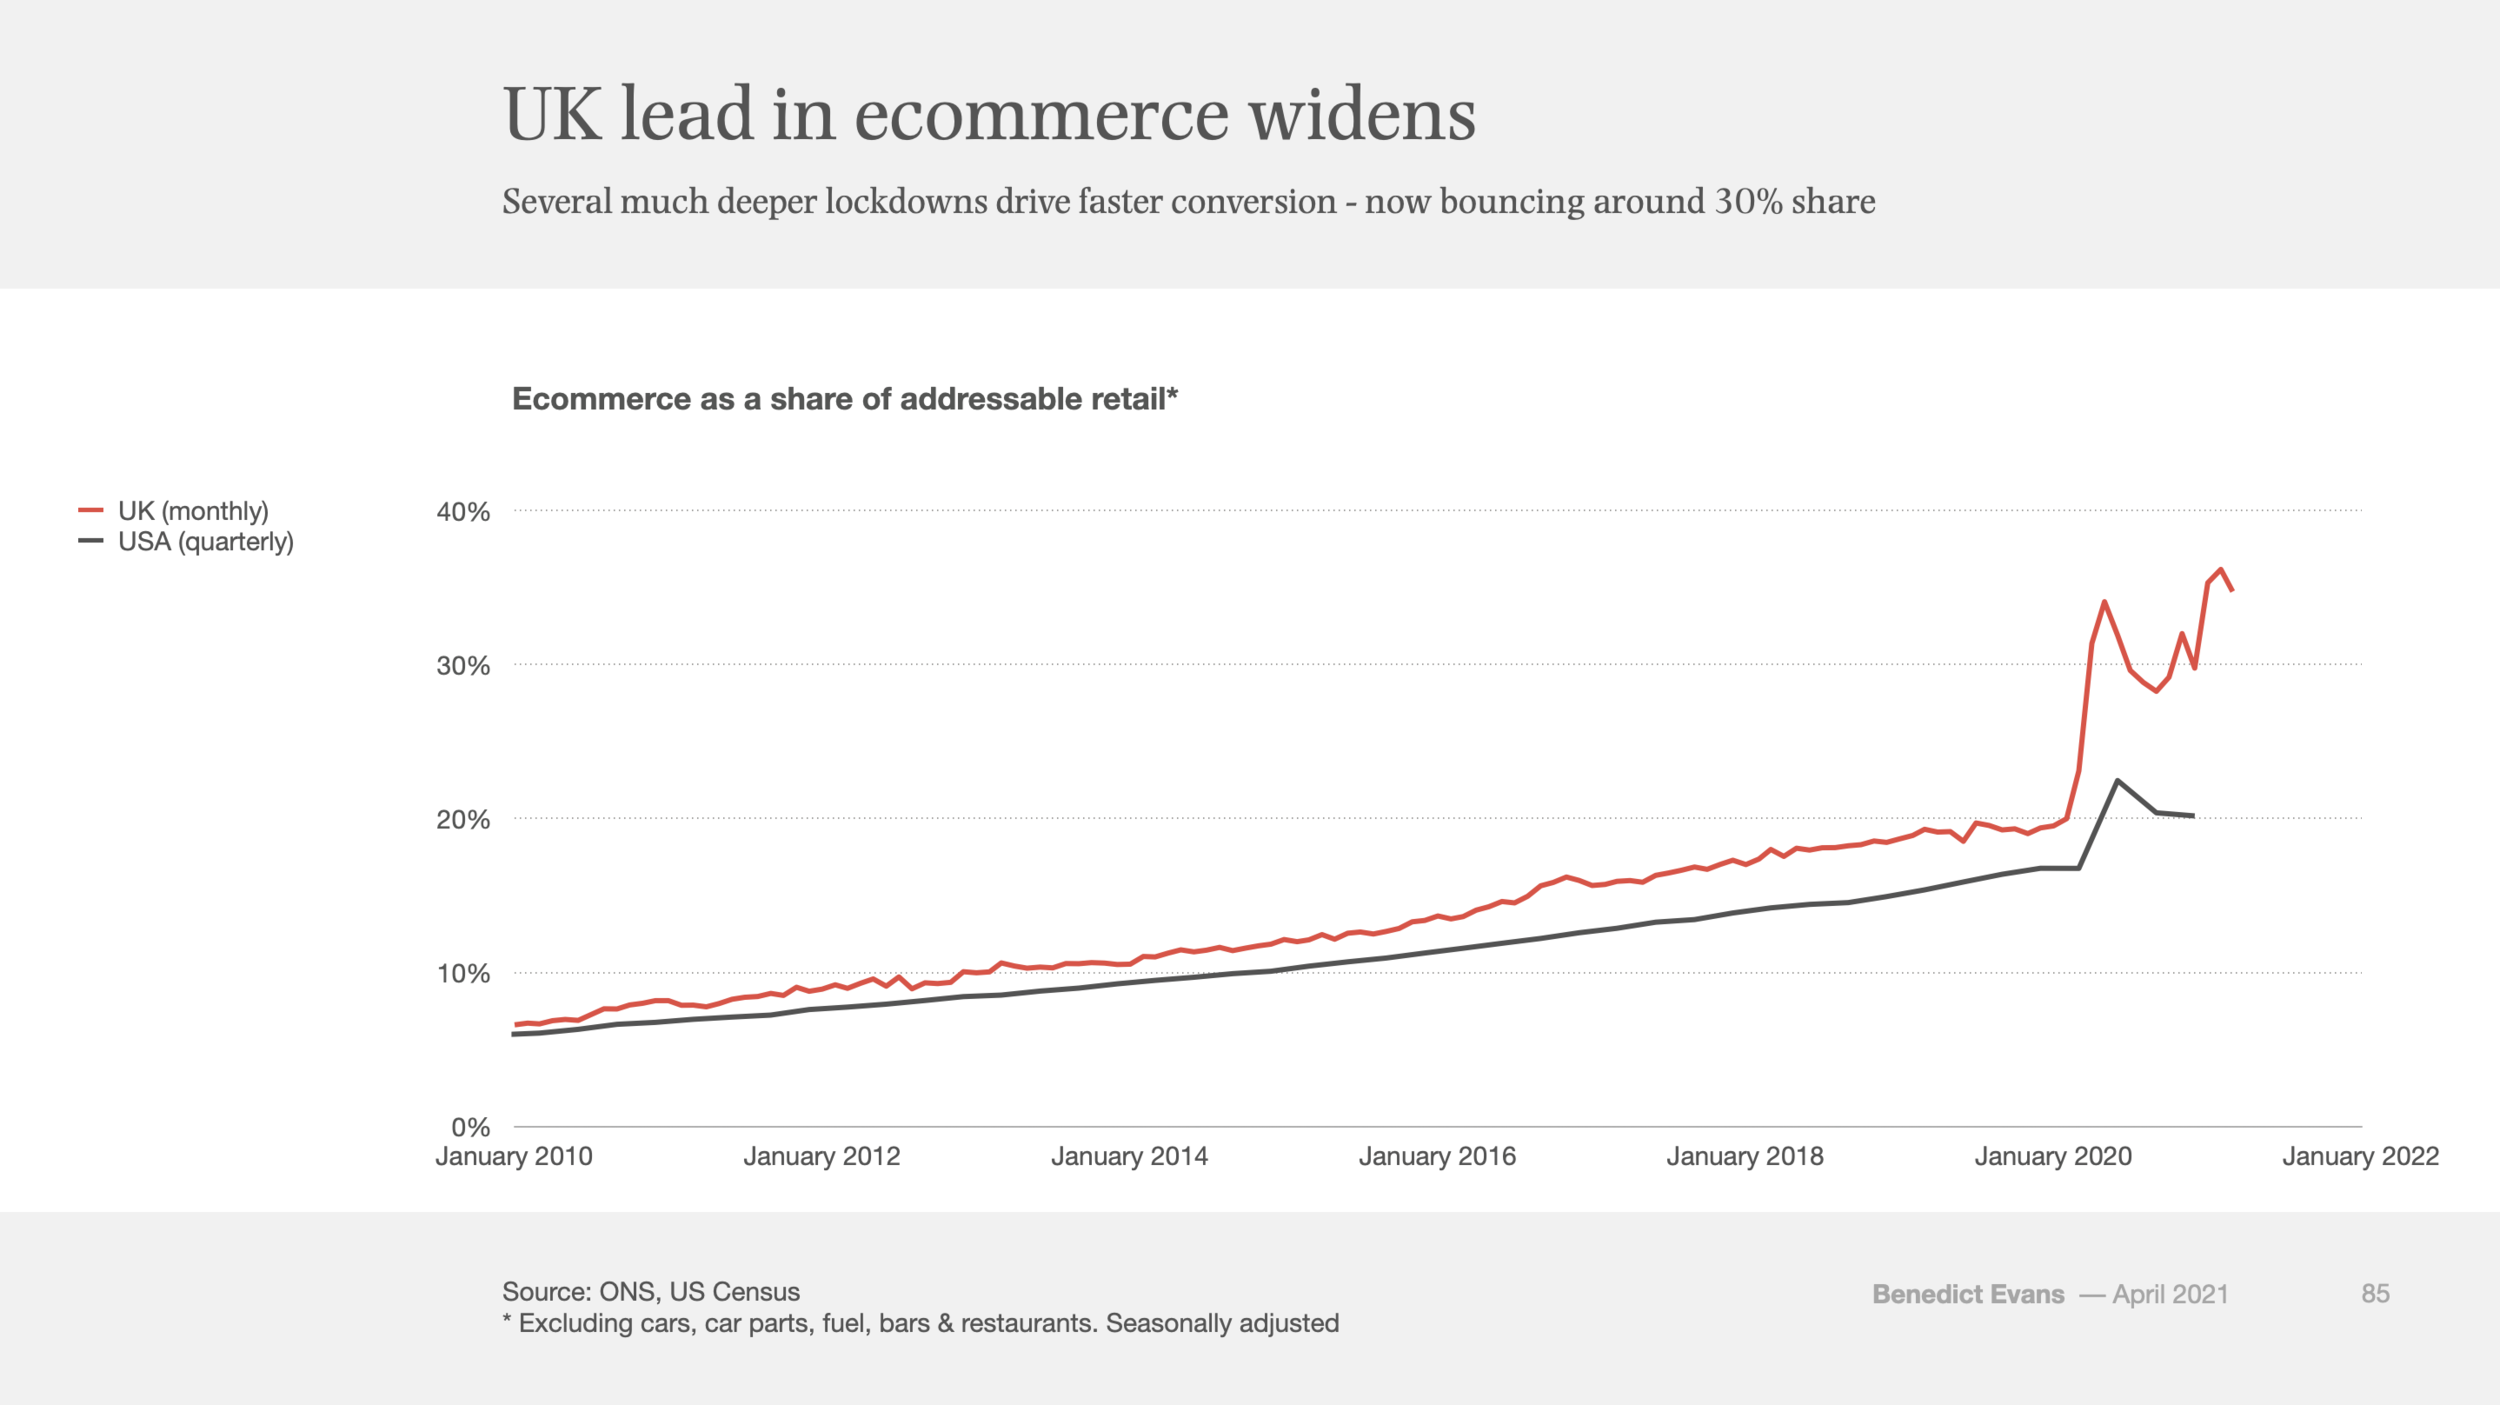
This might be quite an important chart.
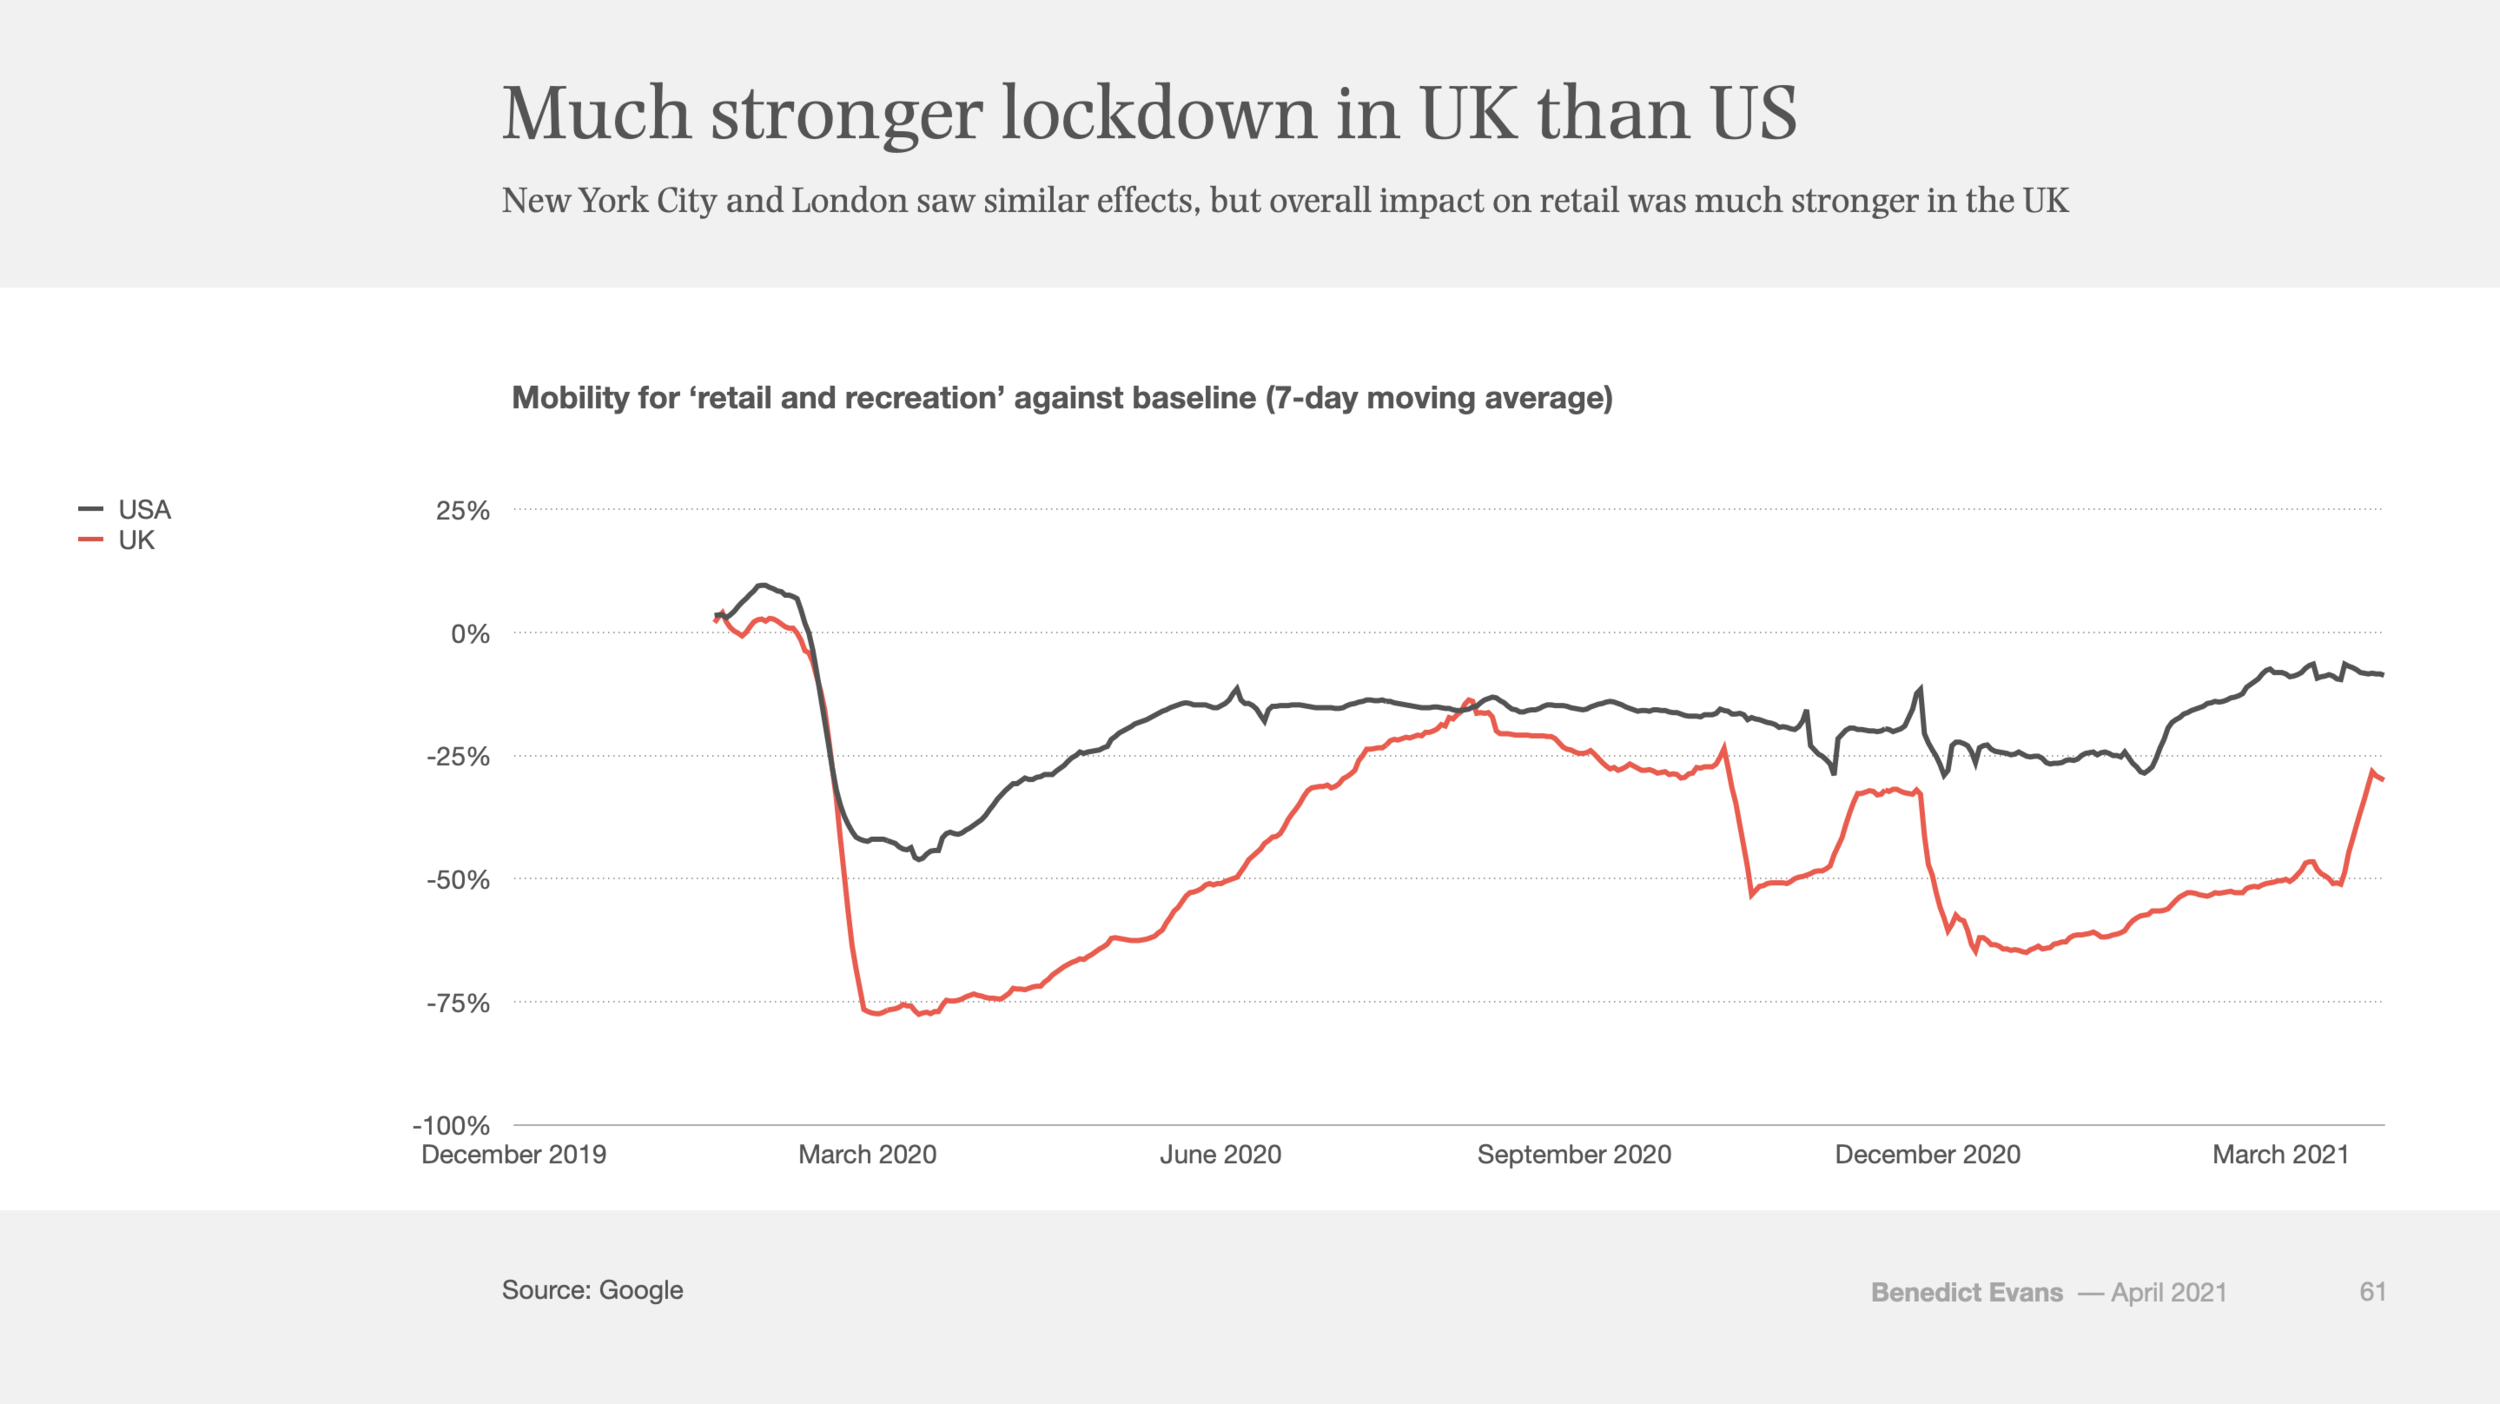
The lockdowns of the past 12 months led to a lot of forced adoption and forced experiment, and a lot of future growth was pulled forward into a couple of quarters in all sorts of sectors. But the UK had a much more rigorous lockdown than the USA, and it had a much larger increase in e-commerce adoption.
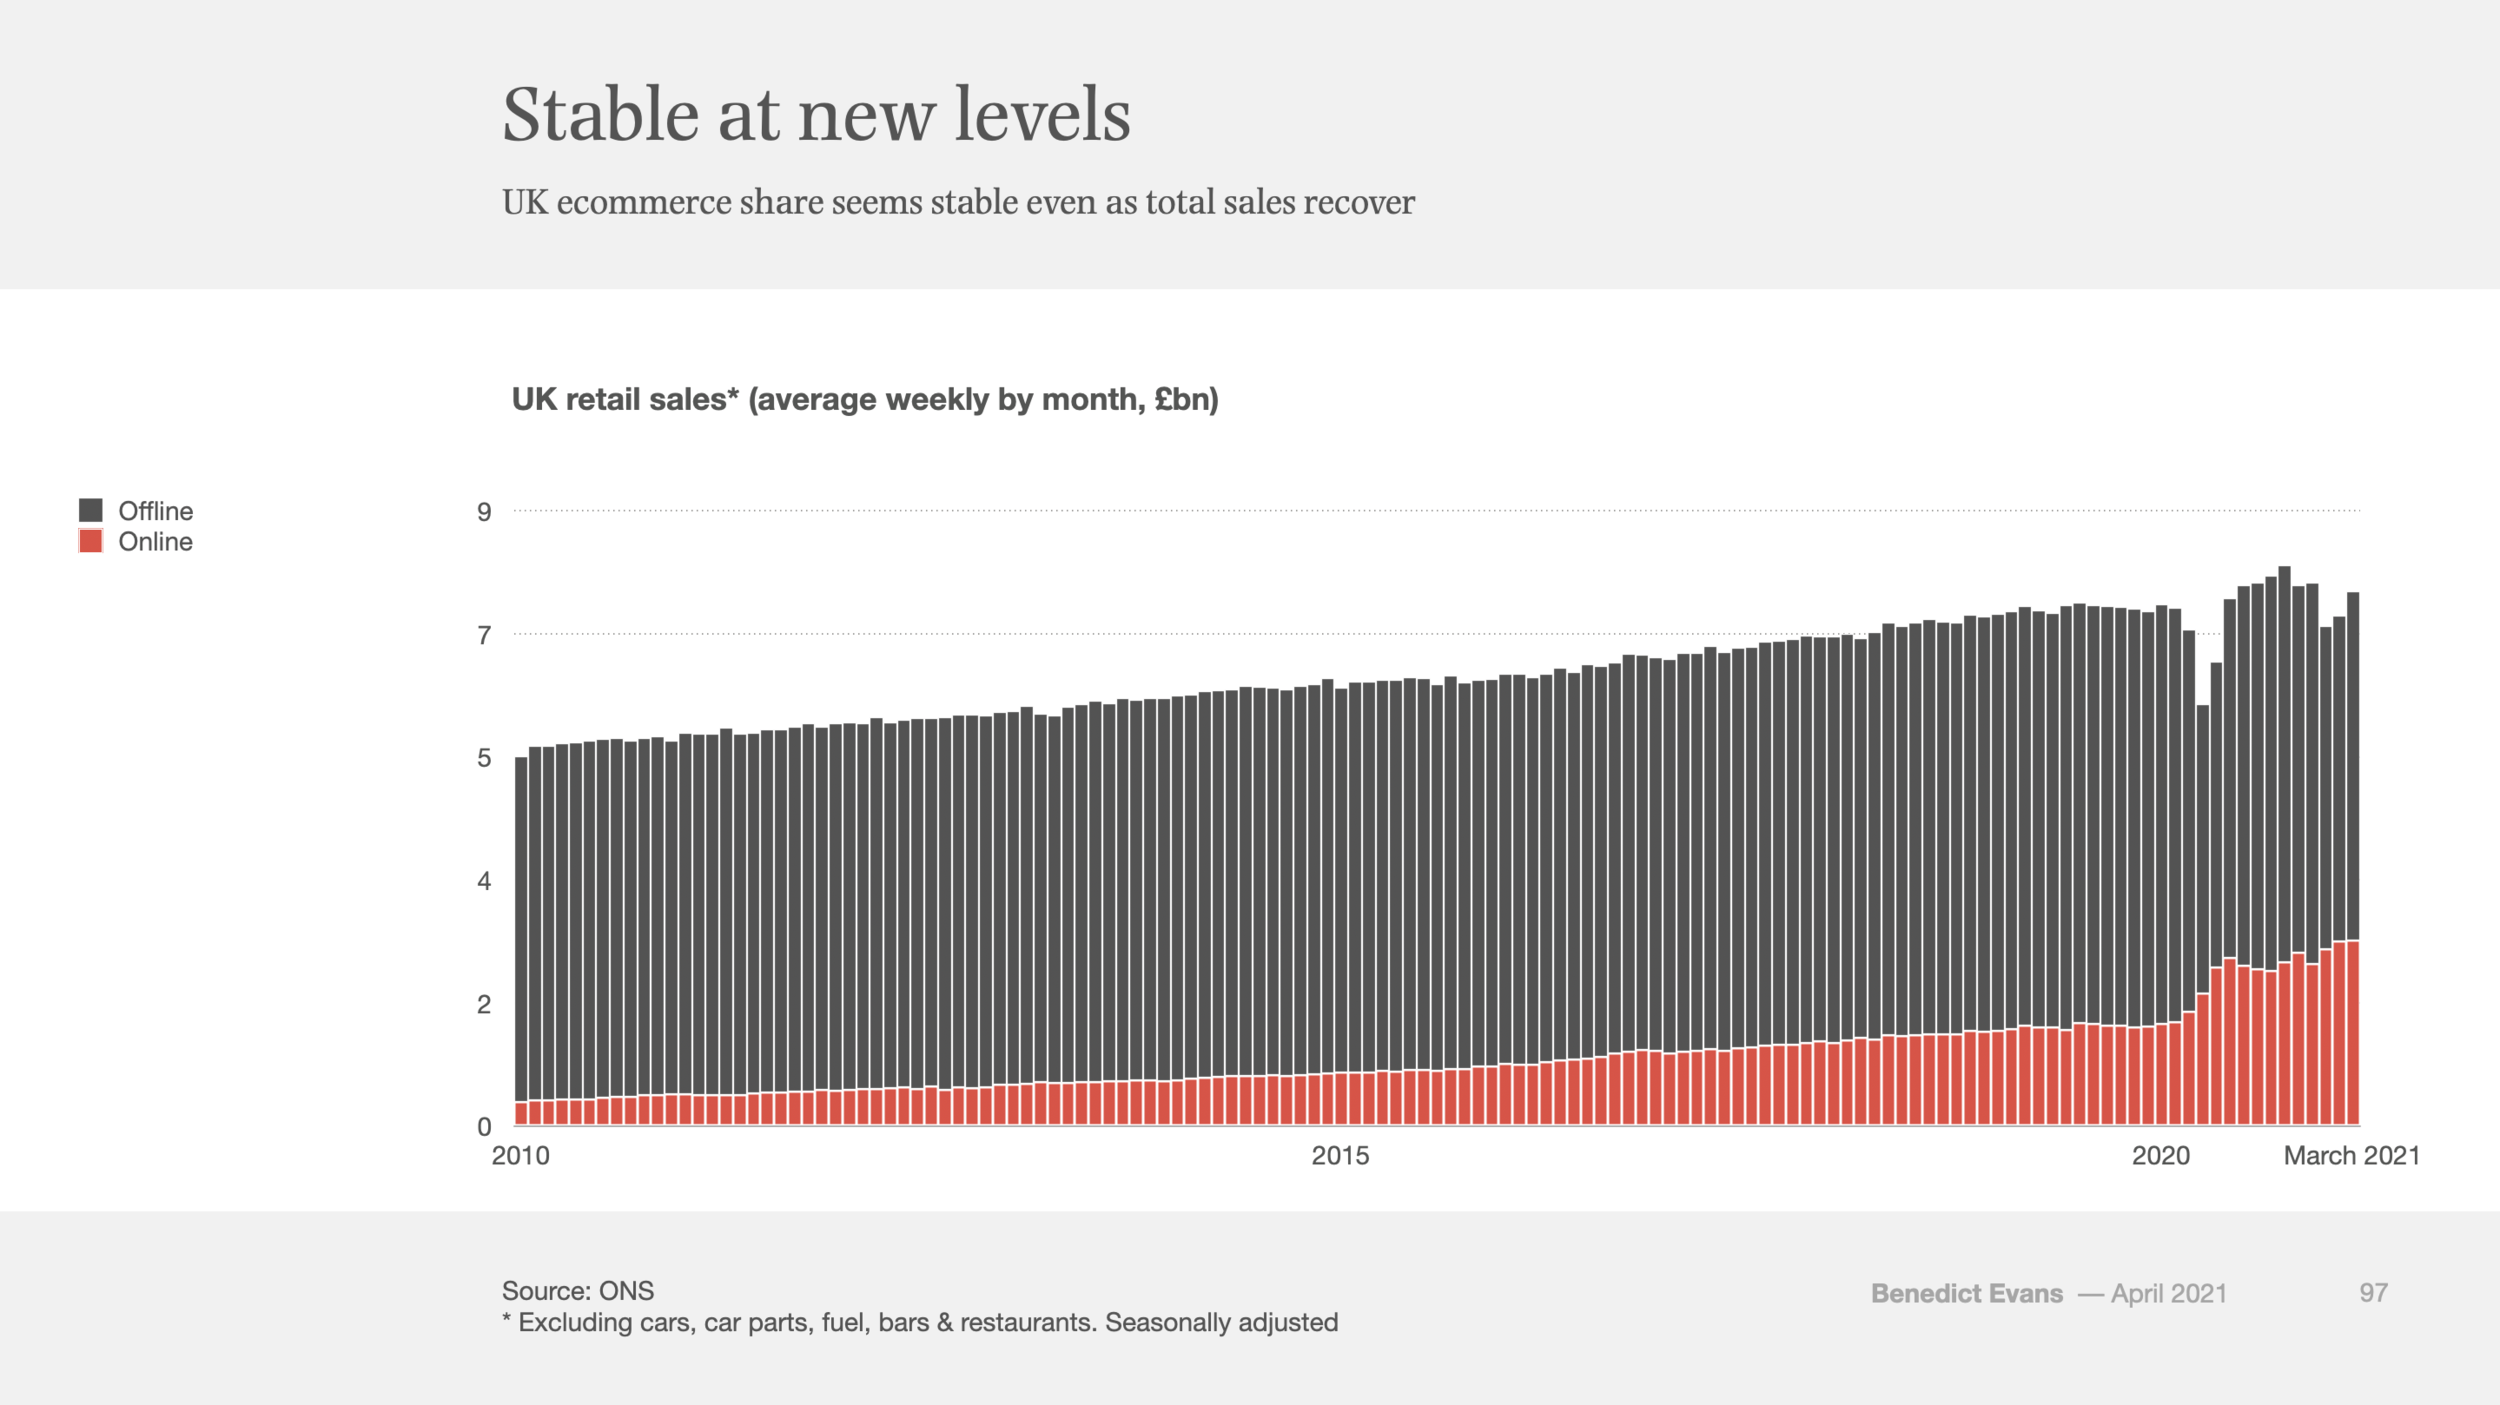
Hence, some of the swings in the ecommerce percentages reflect the fact that physical retailers were closed (alway check your denominators!) - but we’re clearly heading past that now. This chart shows the impact of the UK lockdown on overall retail, but also ecommerce holding steady as total sales recovered.
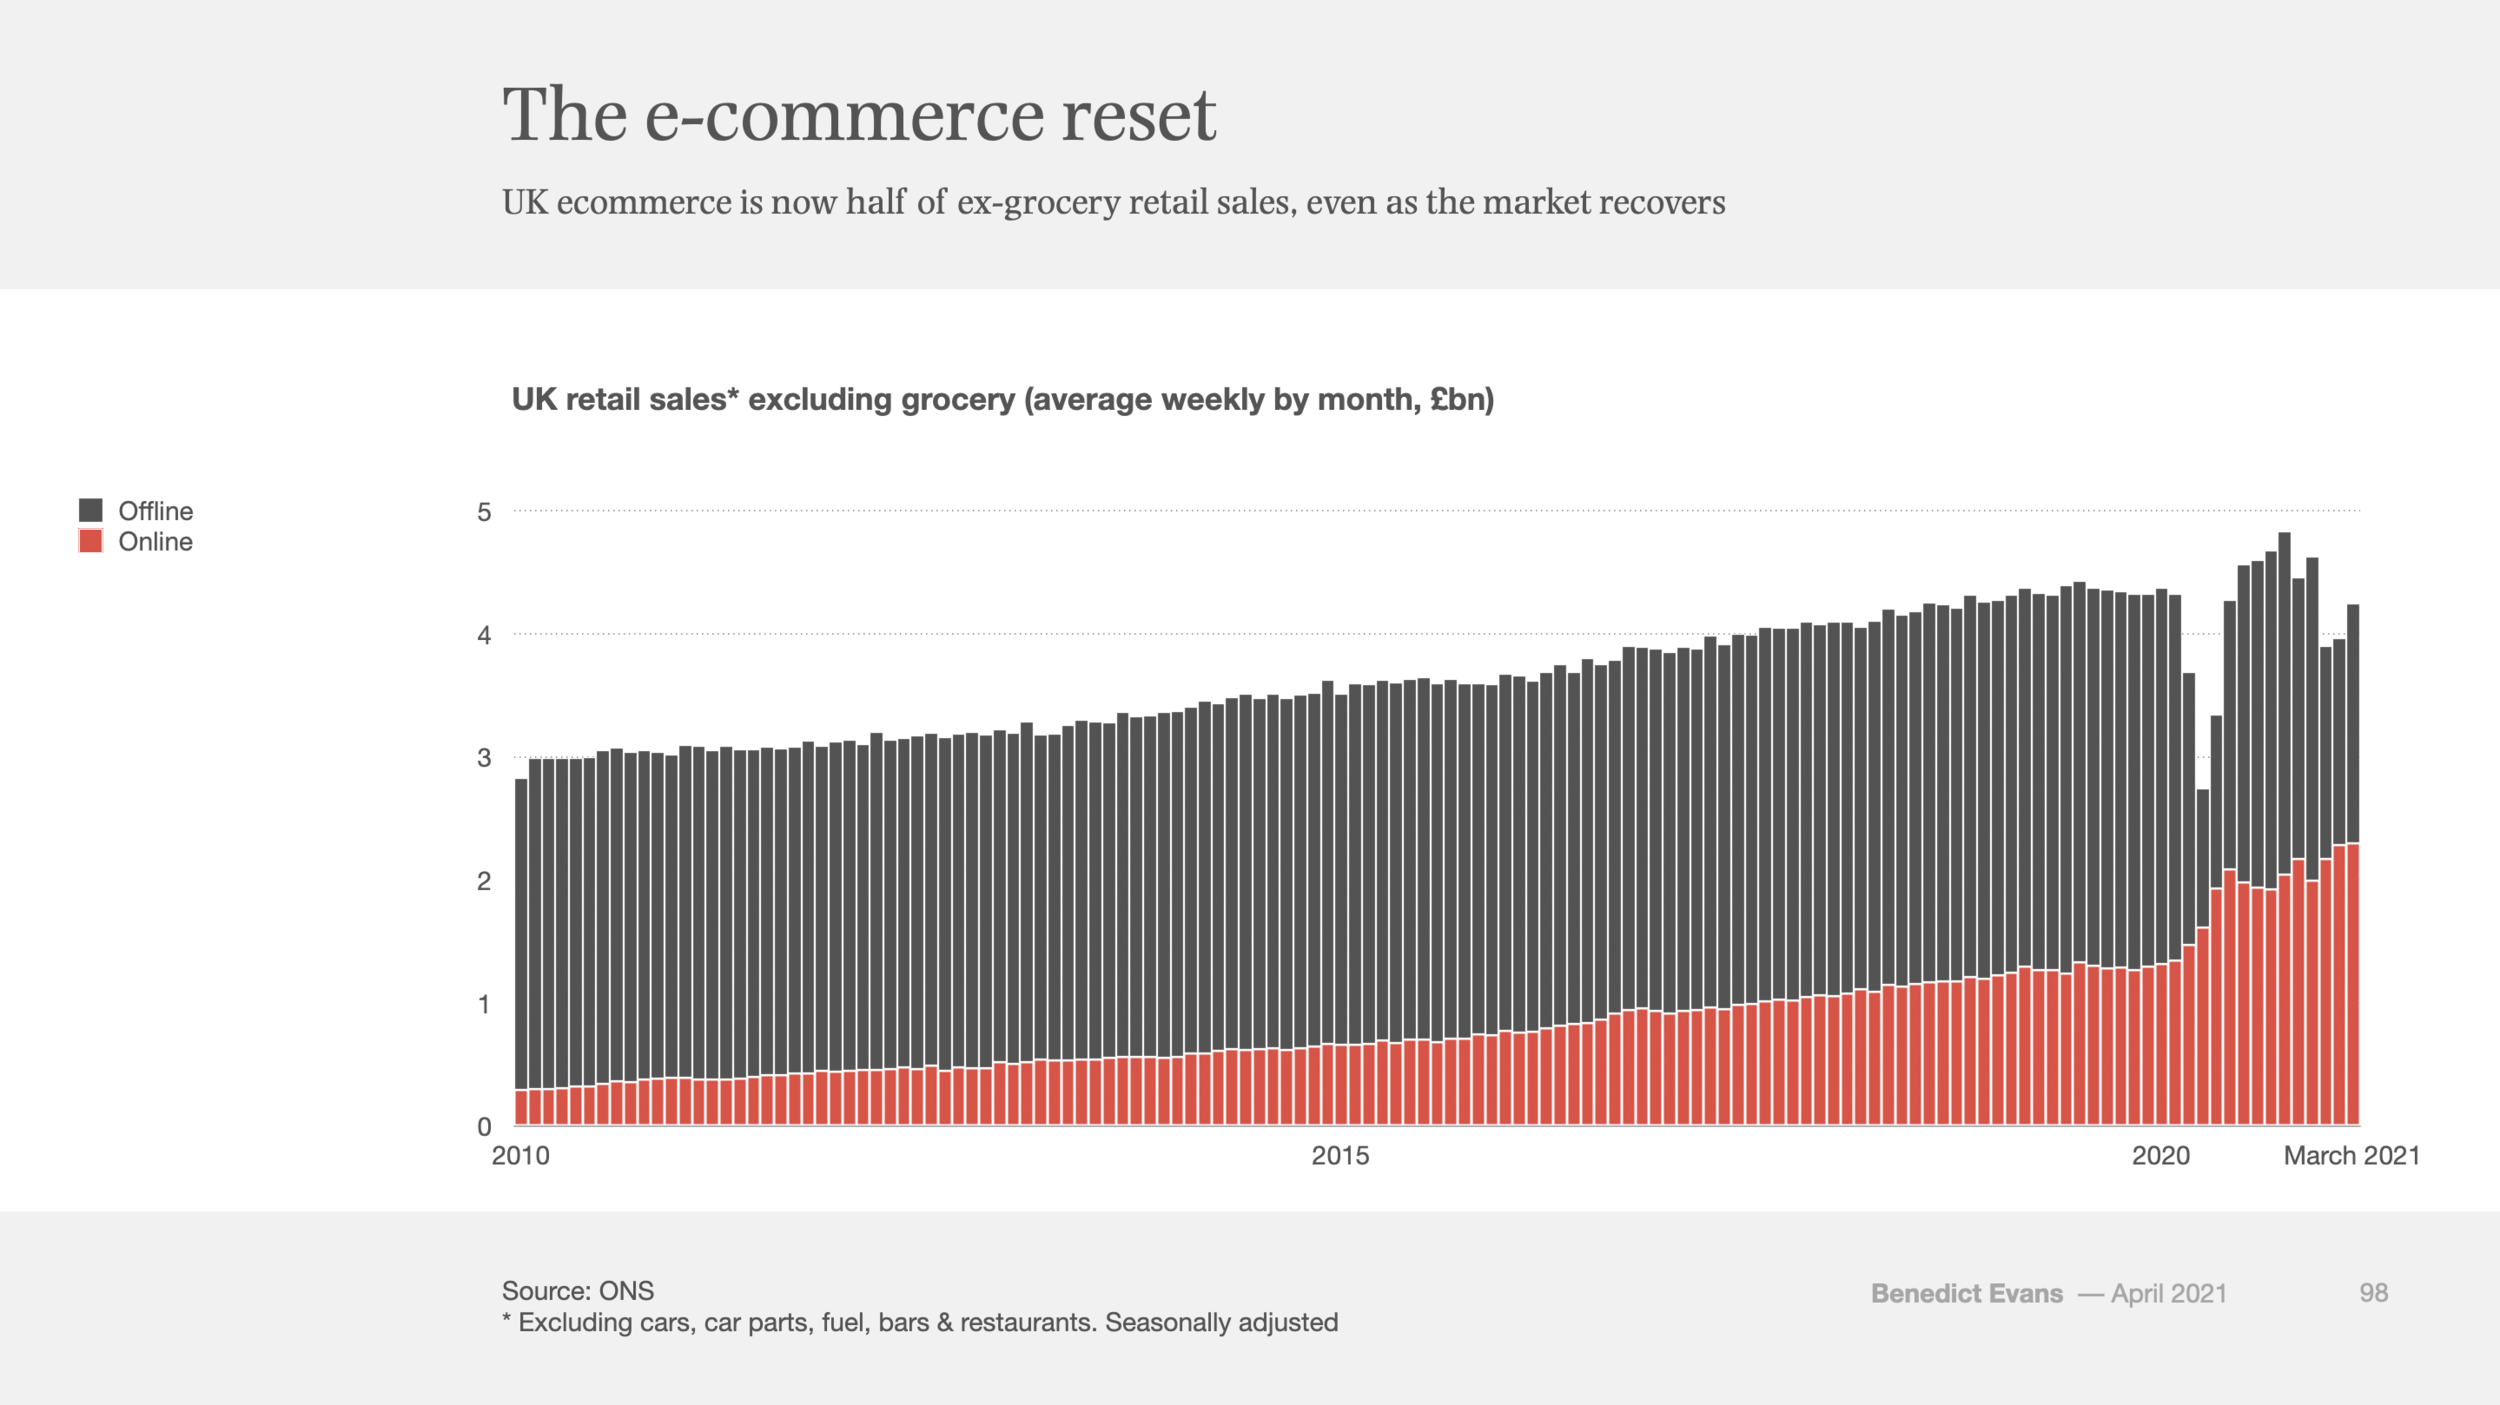
The picture is clearer if we exclude grocery sales. If we treat that as a separate market, since it requires an entirely different logistics model (as I discussed here), ecommerce is now half (!) of UK retail.
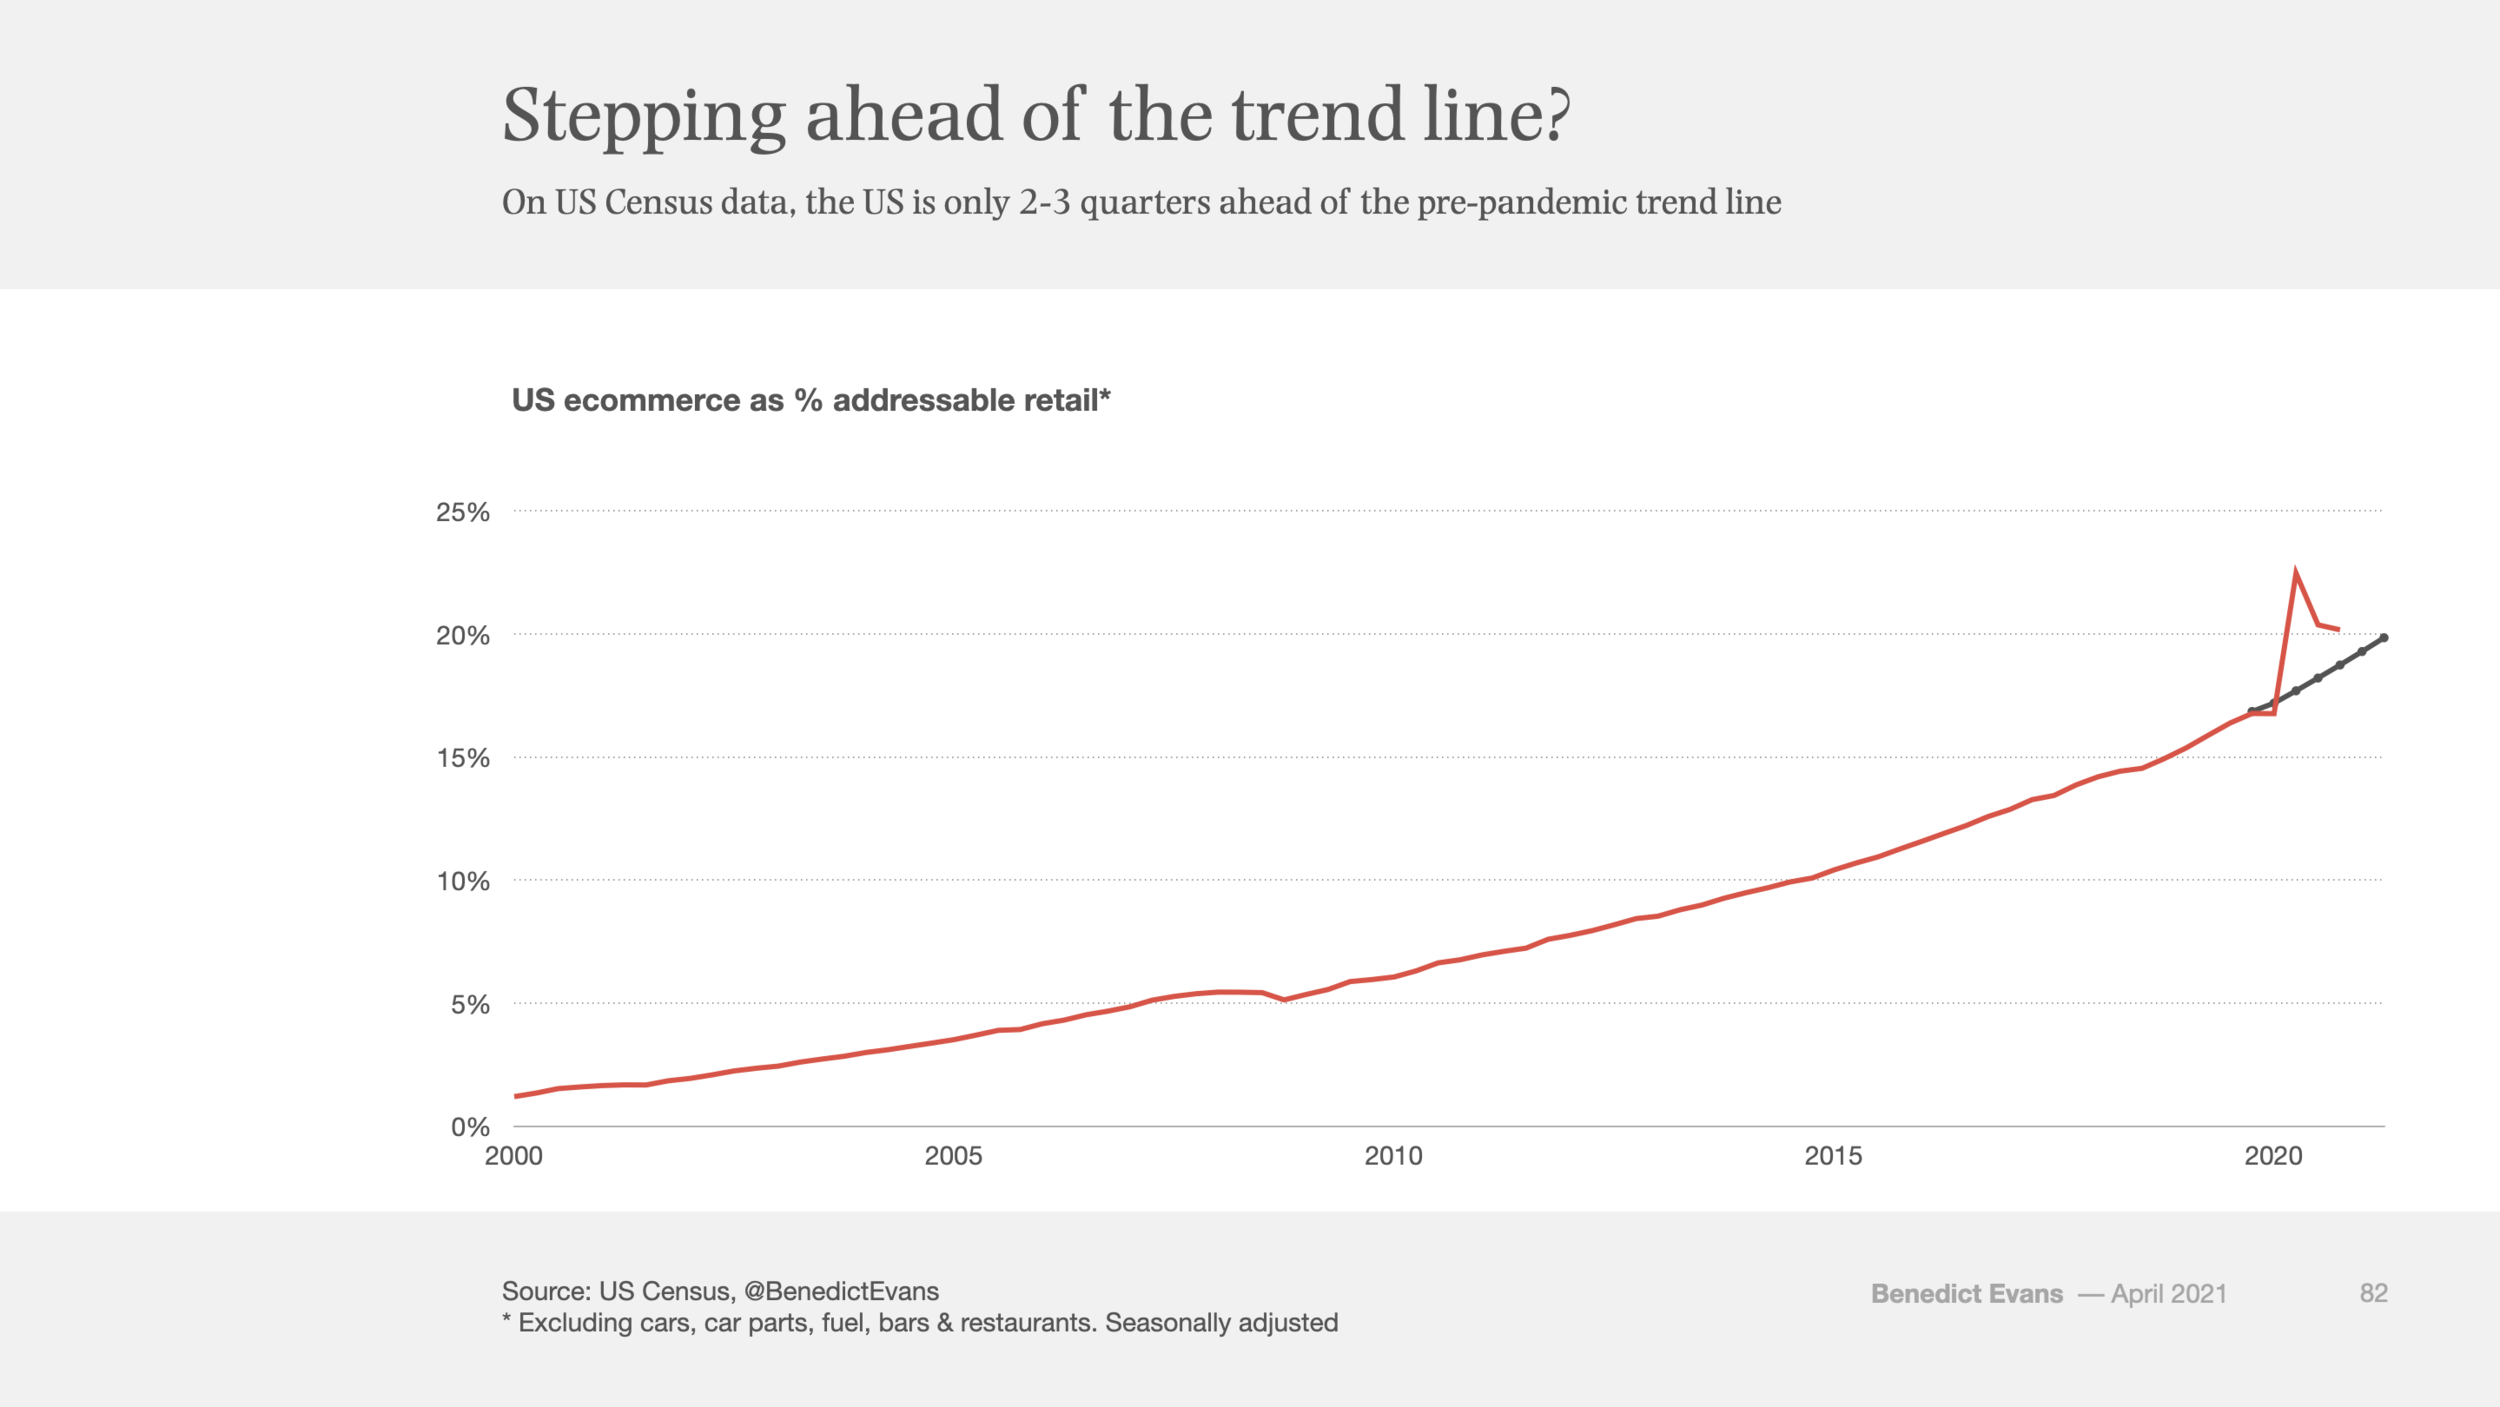
Meanwhile, looking again at the US data, one could suggest a narrative violation. Last year some people got very excited about a viral chart that claimed US ecommerce had grown enormously. That was based on someone misreading the Census data. But in fact, the growth in US ecommerce in 2020 only took it two to three quarters ahead of the trend line. This was already happening anyway.
‘No-one knows anything’, everything is swinging back and forth, and the UK is only barely coming out of its second (and probably final) lockdown. Equally, the Google mobility data demonstrates that the lockdown was very variable across the US, and ecommerce adoption is probably very variable as well (though the BLS doesn’t report regional data). And the high-water marks of the pandemic probably won’t be retained.
But if the UK continues to have 50% or more higher adoption of e-commerce than the USA, that might have some very interesting consequences for start-up ecosystems, as well as physical retailers and commercial real estate, with all of the second and third order consequences that flow from that.
